Master Bullish Candlestick Patterns for 20%+ Gains: Proven Strategy! :
Bullish Candlestick Pattern Explained
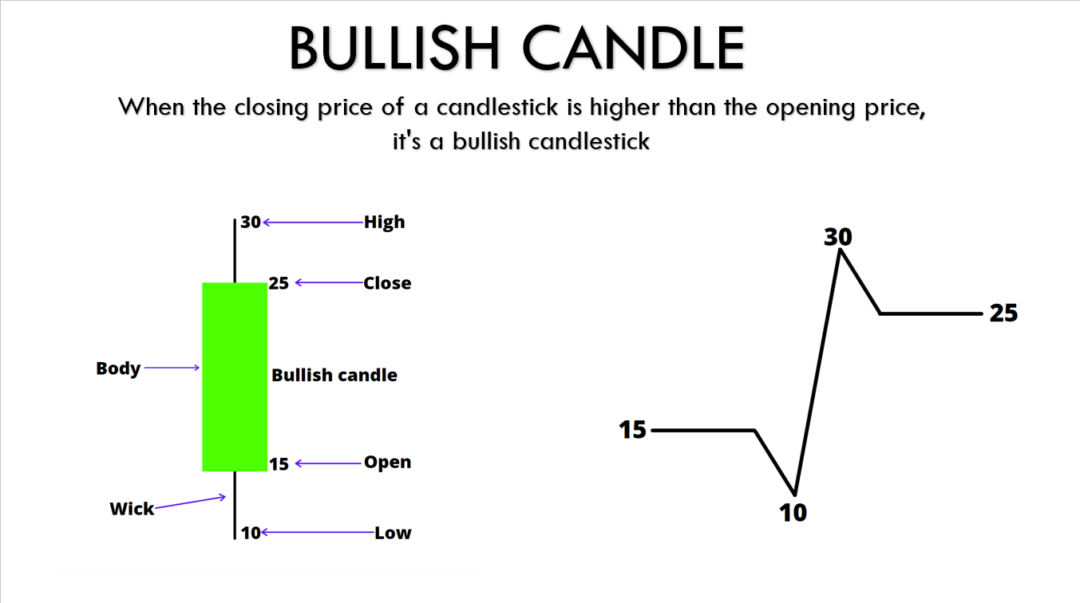
A bullish candlestick Pattern represents a period where the closing price of an asset is higher than its opening price. This indicates that buyers were in control, pushing the price higher by the time the period ended. Bullish candles are often associated with potential upward trends or buying momentum in the market.
Key Components:
- Body: The rectangular portion between the opening and closing prices. In a bullish candle, the bottom of the body represents the opening price, while the top of the body shows the closing price.
- Wicks (or Shadows): The thin lines extending from the body indicate the highest and lowest prices reached during the period. The top wick shows the high, while the bottom wick shows the low.
Example:
- Opening Price (15): The price at the start of the period.
- Closing Price (25): The price at the end of the period, which is higher than the opening.
- High Price (30): The maximum price the asset reached.
- Low Price (10): The minimum price during the time period.
In this example, the price opened at 15, briefly dropped to 10, then surged to 30, and finally settled at 25 by the close. This pattern indicates strong buying interest and suggests that the price could continue rising.
© The hammer trader